打开APP
userphoto
未登录

开通VIP,畅享免费电子书等14项超值服

开通VIP
062
userphoto

2009.05.11

关注

Friday, November 17, 2006

Pfft....

Well, they got us again today, didn't they? Market started off with a nice tumble, flitted around for most of the day, then surged at the end. This gets old.

I am surprised I missed this before, but here's a fascinating angle on the Russell 2000 from a Fibonacci perspective. Using Fibonacci extensions, you can see the predicted high on the Russell based on prior high/low extremes (the high being in 2000 and the low being in 2002). This week, the Russell ($RUT) touched this line almost perfectly, within less than one point of the predicted level. Worth noting.


Yesterday was a chart heavy day, so today just a couple for your consideration. Fluor (FLR):


And General Dynamics (GD):


Have a good weekend, everyone.

Thursday, November 16, 2006

Profits in the Face of Gains

It was one of those nice days where the market went up but my portfolio went up as well (in spite of being completely short). Weakness in oil and gold were the reason.

Taking a look at the NASDAQ Composite, it's pretty plain that the market is at the upper boundaries of an ascending channel. Setting aside bullish/bearish arguments, don't you think it's time for the market to take a breather? Even if we're in a bull market for years to come, it doesn't go straight up. This graph alone should persuade you that it's more likely to ease off than push above the bounds.


The same argument, but for different reasons, applies to the S&P 100 ($OEX). Look how far above the 100/50/30 day moving averages the price is. It hasn't been this lofty since December 2003 (and you can see the softening that happened afterward). We've come very far, very fast.


As I mentioned, gold was weak today. I like how this graph is shaping up. The stop remains the same as noted earlier.


Now here's an interesting and unusual graph. I plotted YHOO and GOOG onto the same chart, each with their own independent axis. What's fascinating to me is that during the first half, the stocks tended to share the same fate. But during the second half, it's clear that GOOG has kicked YHOO's butt, and there's a growing rift between these two. Does it mean that GOOG will eventually "catch up" with YHOO by drifting down sharply? Or that YHOO is simply a company of the 90's and will never catch up again? Time will tell.


Now on to some specific short favorites. Here's AEM, which takes advantage of gold's weakness.


AL is a good play on weakness in industrial metals.


ARE is a very clean short in the world of real estate.


I like MRO as an energy short.


COF is shaping up nicely. I've mentioned this numerous times.


HYDL is another sweet looking short.


We're still in "a new high every day" mode. This can't last forever. You know that as well as I do.

Wednesday, November 15, 2006

No Man's Land

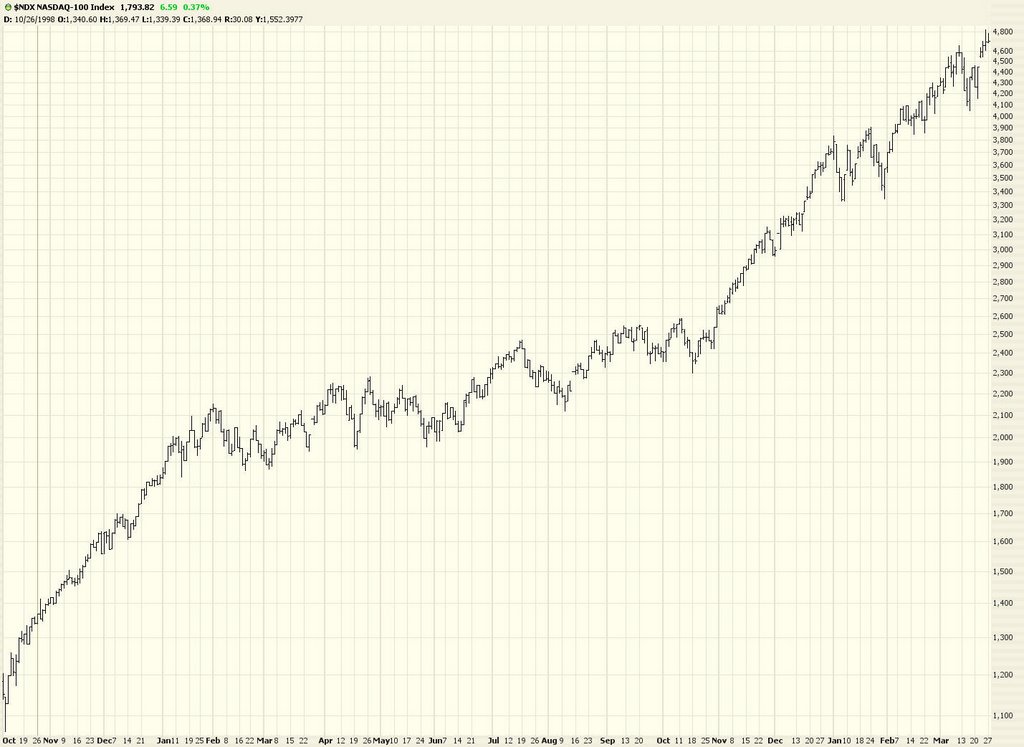
I have an interesting graph to show you. Here it is:


Amazing market, isn't it? Nothing but strength. What's salient about this graph is that it's an image of the $NDX, and the rightmost price bar is the peak in March of 2000. As you can see, there's hardly any warning about what's going to happen. But this is what a market looks like before it collapses.

What can you draw from this? Probably not much. Obviously rises proceed collapses. And just because a market goes up a lot doesn't mean it's going to go down a lot. What I find somewhat chilling about this graph is how little warning anyone was given, even with the Dow selling off the last two months of this graph. Food for thought.

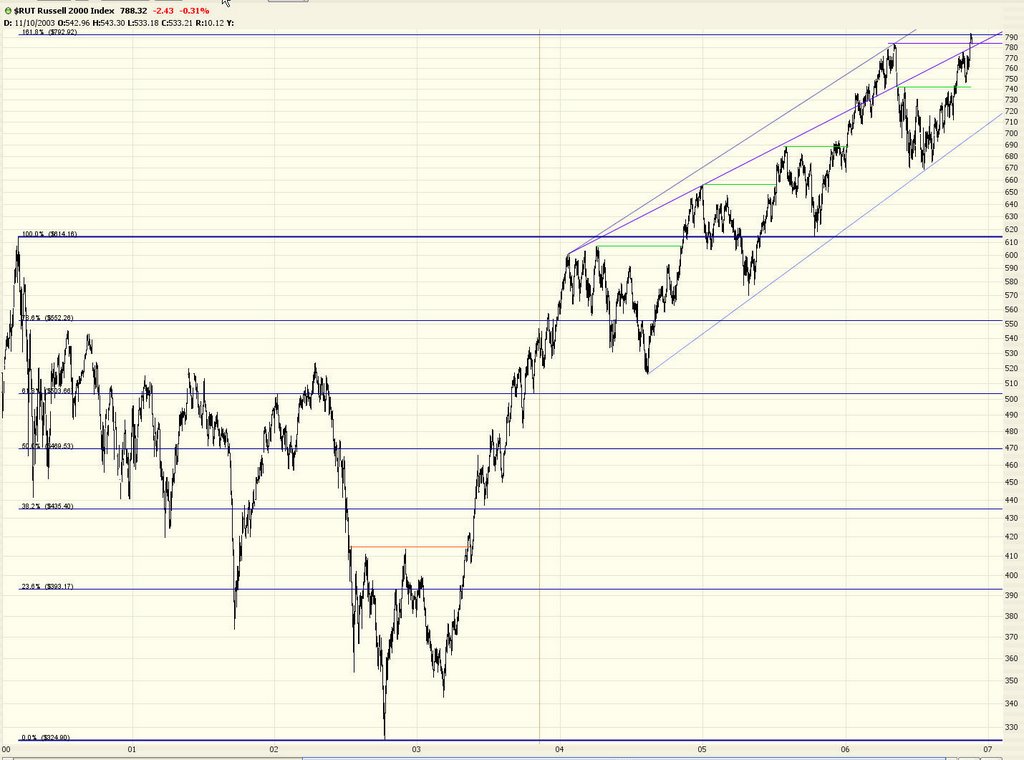
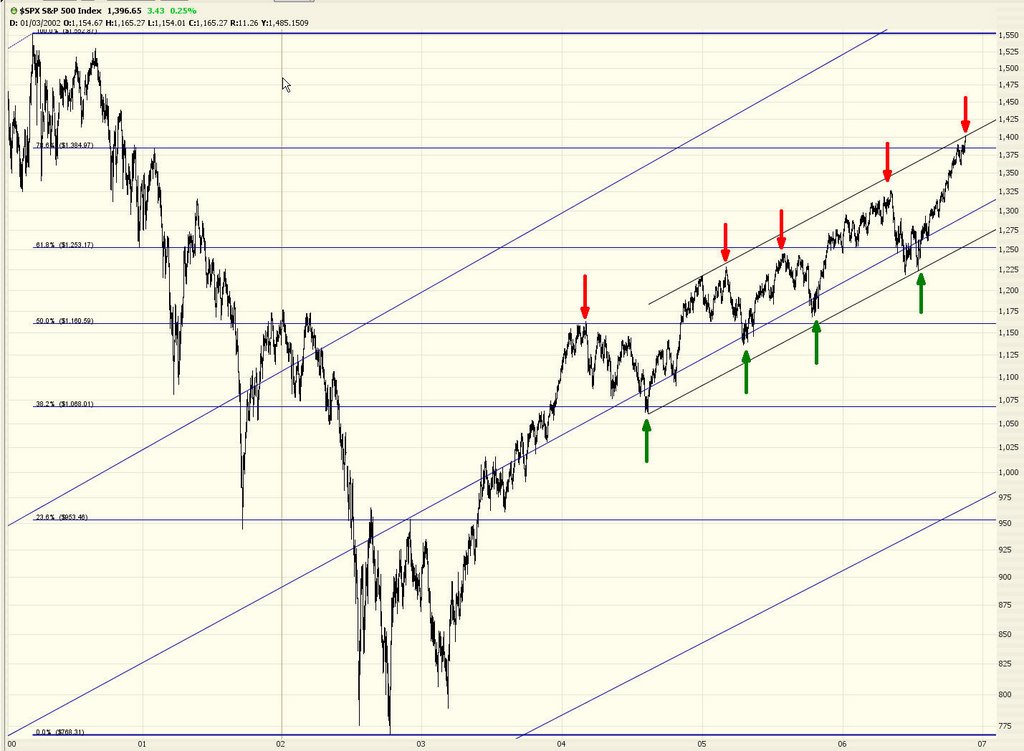
One of my favorite charts is the long-term view of the $SPX. I've marked up this chart with lines galore, but you get the idea. As you can see, we remain at the tippy-tippy-top of the ascending channel.


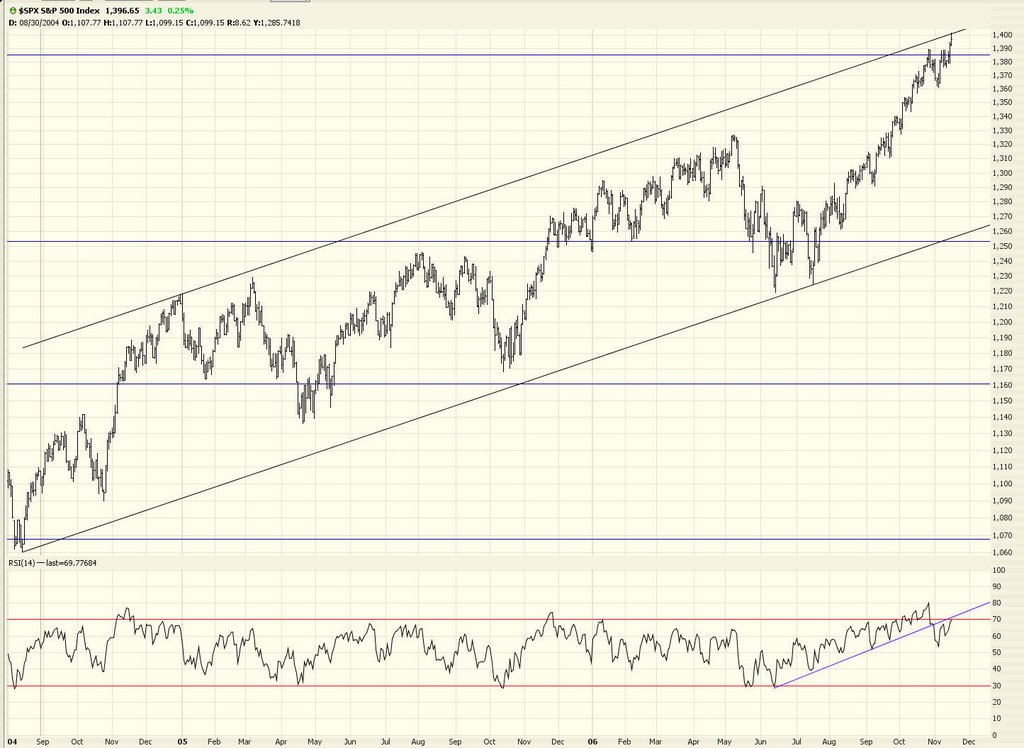
A closer view shows more clearly this top (oh, and for those that don't know, just click on any image to see a much bigger chart). Also remarkable is the trendline I've drawn on the RSI which has been cleanly broken.


The Dow Utilities, which go largely ignored in most commentaries, has been a non-participant in the recent rally. Worth noting.


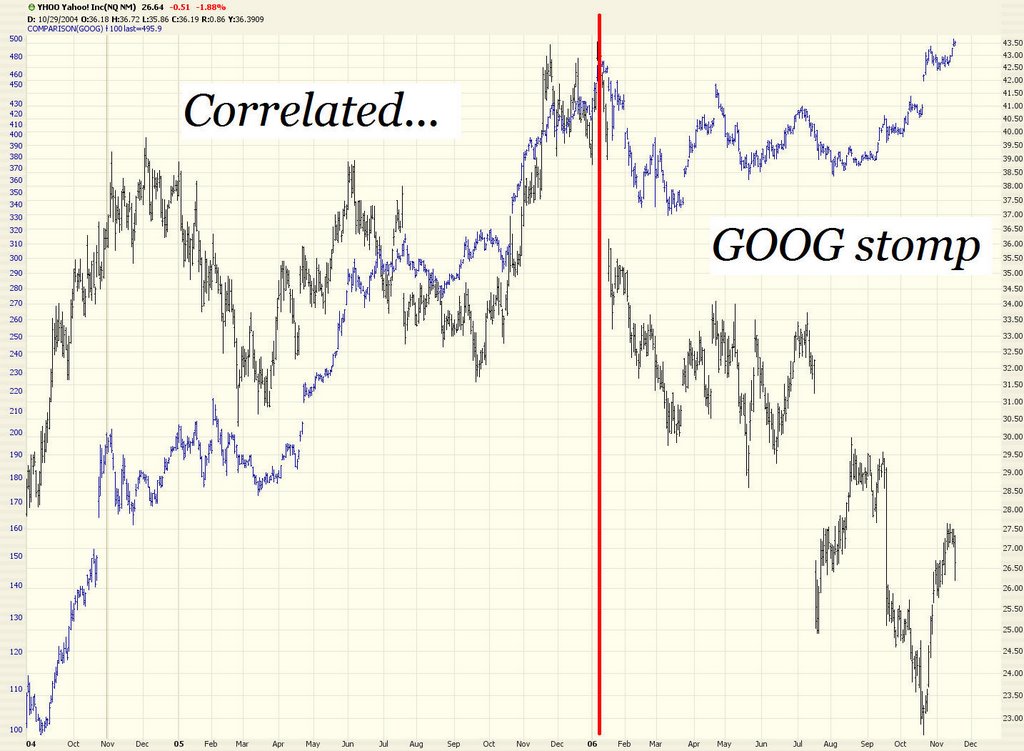
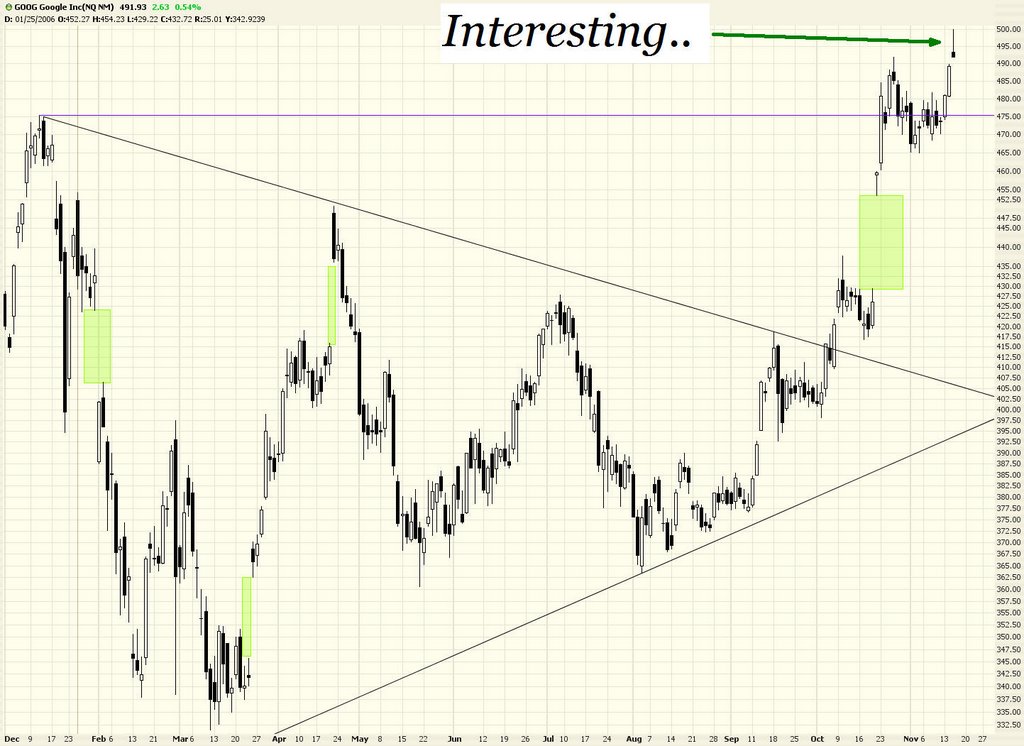
I mentioned GOOG yesterday as a very attractive chart. It is, but just like SHLD, it hasn't really exploded off its pattern yet. I find it interesting today that the "$500 for the sake of $500" crowd couldn't manage to push the stock above this lofty level, and the chart was left in a shooting star pattern for the day.


For the moment, I'm glad I turned the comments section back on to anonymous posters. It's rocking and rolling again. We'll see if people keep the discourse civil this time.

本站仅提供存储服务,所有内容均由用户发布,如发现有害或侵权内容,请点击举报
打开APP,阅读全文并永久保存 查看更多类似文章
猜你喜欢
类似文章
【热】打开小程序,算一算2024你的财运
Fahrenheit_to_Celsius___Chart&Graph
雅思小作文各种图题、表格题技巧总结
打造初中满分英语作文,秘诀在这里
2016年6月英语六级高频句型
英语写作中不得不用的好句子之段首句
名词也可以当副词来用吗(作状语)
更多类似文章 >>
生活服务
热点新闻
分享 收藏 导长图 关注 下载文章
绑定账号成功
后续可登录账号畅享VIP特权!
如果VIP功能使用有故障,
可点击这里联系客服!

联系客服