
Bind9, since version 9.5, offers an experimental embedded web server which can provide statistics abound Bind through HTTP. Upon enabling, one can access this web server and get an XML response full with various statistics.
Enabling the feature is quite easy. One just needs to add some lines like the following inside Bind’s configuration file:
statistics-channels { inet 127.0.0.1 port 8053 allow {127.0.0.1;};};
Restart Bind and try connecting to the statistics-channel. For example through curl:
$ curl http://127.0.0.1:8053<?xml version="1.0" encoding="UTF-8"?><?xml-stylesheet type="text/xsl" href="/bind9.xsl"?><isc version="1.0"> <bind> <statistics version="2.2"> <views> <view> <name>_default</name> <zones> <zone> <name>0.in-addr.arpa/IN</name> <rdataclass>IN</rdataclass> <serial>1</serial> </zone> <zone> <name>10.in-addr.arpa/IN</name> <rdataclass>IN</rdataclass> <serial>1</serial> </zone>............ <TotalUse>810834110</TotalUse> <InUse>327646360</InUse> <BlockSize>740556800</BlockSize> <ContextSize>9954232</ContextSize> <Lost>0</Lost> </summary> </memory> </statistics> </bind></isc>
People usually use munin to monitor bind through 2 different ways. The first, usually applied to servers that are not very busy, for example servers with less than 100queries/sec, is to parse the output of the query log. Then a munin plugin that comes with the default munin installation and is called bind9 can parse the query log and create some graphs. The second way for a bit busier servers is to have query log disabled and monitor bind is through the output of the rndc stats command. A munin plugin that also comes with the default munin package and is called bind9_rndc can parse the created named.stats output file and create some nice graphs. To configure either of the two ways one can take a look at this informational wiki: http://wiki.debuntu.org/wiki/Munin/Bind9_Plugin
A third way is to have a new munin plugin get the XML output from the statistics-channel described above and create some even fancier and richer graphs. Luckily a guy called Andrew Duquette has created such a perl plugin for munin. You need to exercise your google skills to find it though, (that is if you don’t cheat searching with his name as a search term!) I took that plugin, made some changes to it and uploaded it to github. The plugin is called bind9_statchannel and you can find it in my github munin-plugins repo.
The changes I made were the following:
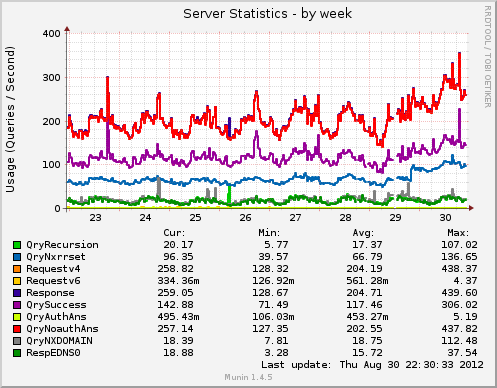
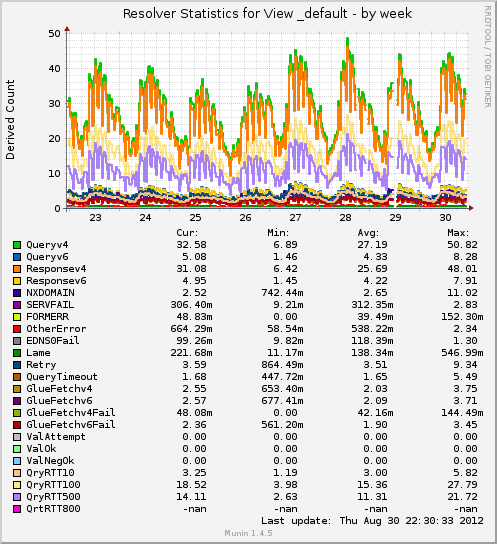
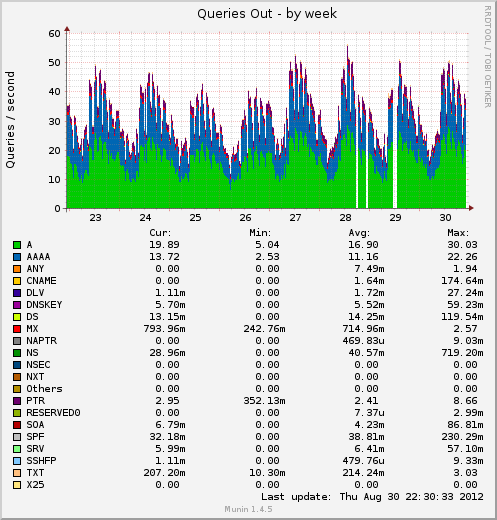
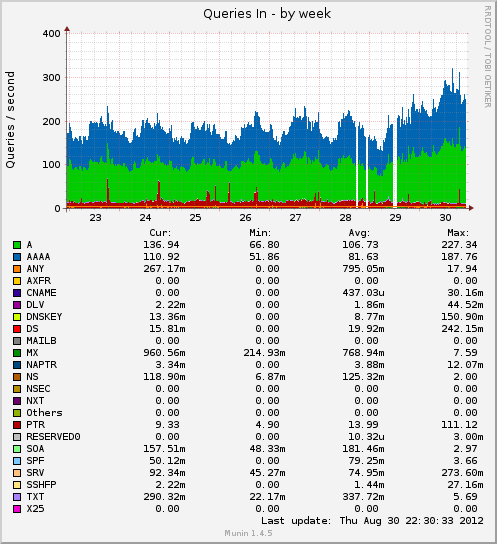
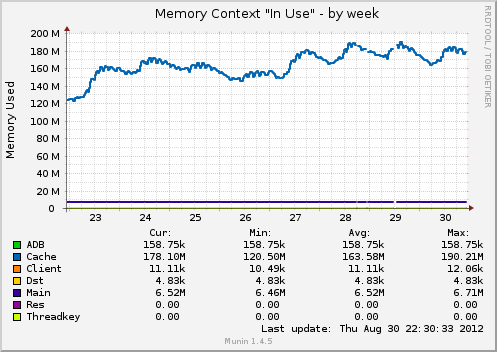
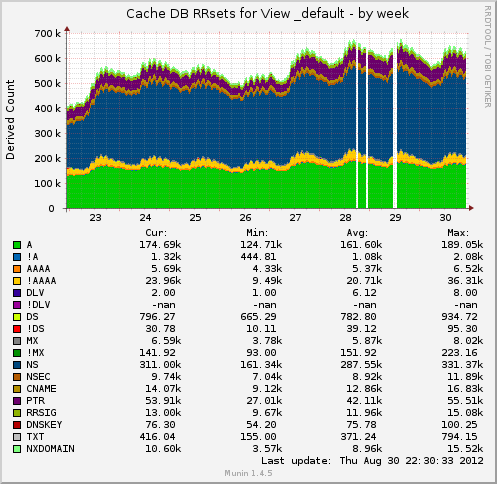
The plugin creates the following type of graphs:
As you can see it can give many more details compared to the other bind9 munin plugins. It’s also the only bind9 munin plugin that can tell you how many incoming vs outgoing queries there are, as well as the only one that can tell you how many queries you have over IPv4 vs IPv6.
To use it on Debian you need to at least install the following two perl packages: libxml-simple-perl, liblwp-useragent-determined-perl
Here are some sample graphs from the bind9_statchannel plugin:
If you have any bug fixes, code changes, etc please don’t hesitate to fork and open a pull request on github.
Download: bind9_statchannel

联系客服

