Mar. 11, 2022 4:10 AM ET
BAPR,
BAUG,
BJUL13 Comments14 Likes
Summary
On March 9th, 2022 the Federal Reserve conducted their final open market purchase effectively ending the Covid QE program started in March 2020.
The Fed meets again on March 16th in the next FOMC meeting to decide on interest rate increases and steps to address rising inflation.
This article looks at the impact of the prior three quantitative easing programs and subsequent market effects after each program ended.
A major focus is on the quantitative tightening period and how that may again impact markets in 2022.
QE periods were the most positive for the S&P 500 returns, while the QT activity in 2018 was the most negative.
Looking for a helping hand in the market? Members of Value & Momentum Breakouts get exclusive ideas and guidance to navigate any climate.
Learn More »CasarsaGuru/E+ via Getty Images
Introduction
This article looks at the potential market impacts of ending the fourth and latest Quantitative Easing (QE) program by the Federal Reserve. We have three prior QE programs to review for analysis. In addition, several tapering periods and a Quantitative Tightening (QT) period will also be reviewed for market impacts. The Federal Reserve uses the phrase "asset normalization policy" to represent the reduction of their balance sheet with essentially the same meaning as balance sheet tightening.
Executive Summary
There have been four QE programs conducted by the Federal Reserve since the Global Financial Crisis through March 9th, 2022. The following average returns have been observed in each of the different periods:
S&P 500 (
SPY) returns during all 4 QE periods totaled +118.2% averaging +1.55% per month.
S&P 500 returns after the conclusion of the 3 prior QE periods total +52.14% averaging +0.58% per month.
S&P 500 returns during the 2018 QT period totaled -6.24% averaging -0.52% per month.
We can estimate that the Federal Reserve's quantitative easing has provided market benefits that exceed both the periods without quantitative easing as well as returns in the quantitative tightening period. These strong results confirm that Fed intervention in the markets since the Global Financial Crisis has provided significant benefit and shows why they have returned to this monetary policy four times in the past 13 years. It seems likely the Fed will use QE again in future economic concerns.
VisualCapitalist.com
Many other factors have certainly contributed to market performance since 2008, but for simplicity of analysis this review paints a broad stroke on Fed intervention and does not consider all possible factors that have impacted the markets during these periods.
Analysis
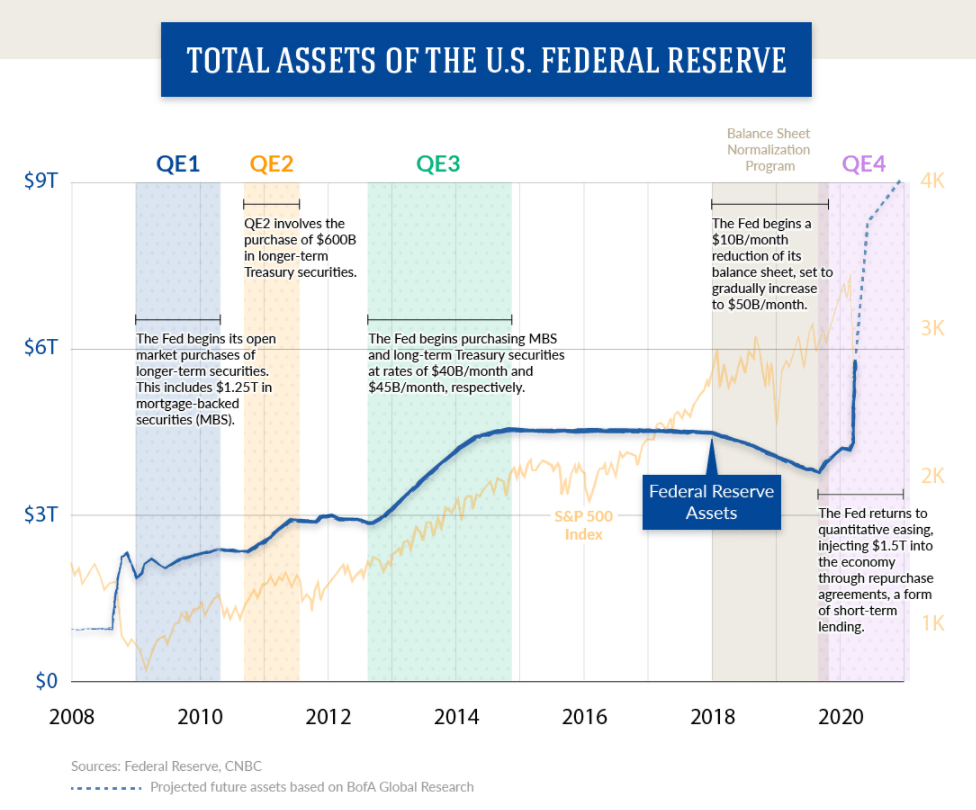
There have been four QE programs conducted by the Federal Reserve from the Global Financial Crisis in 2008 through March 2022. The Fed operates QE by purchasing treasuries, mortgage backed securities and agency debt. By far the largest QE program was the most recent from March 2020 consisting of nearly $6 trillion in MBS and treasury purchases.
Zerohedge.com
We will look at the S&P 500 performance during each these periods as well as the time in between each of these accommodative periods of easing. The purpose is to provide a general forecast of what we might expect now that QE4 has ended and what may occur whenever the next quantitative tightening period begins.
Federal Reserve ProgramS&P 500 ReturnDuration/MoAvg/Mo
QE1 (Nov 2008 - Mar 2010)+20.72%17 months+1.22%
After QE1+6.89%9 months+0.76%
QE2 (Nov 2010 - Jun 2011)+9.21%9 months+1.02%
After QE2+7.10%15 months+0.47%
QE3 (Sep 2012 - Oct 2014)+43.47%26 months+1.67%
After QE3+43.17%39 months+1.10%
QT (Jan 2018 - Dec 2018)-6.24%12 months-0.52%
QE4 (Mar 2020 - Mar 2022)+44.81%24 months+1.87%
The largest average monthly returns for the S&P 500 occurred during accommodative Fed programs of QE. It is also noteworthy that QE4 was by far the largest program and corresponds with the highest monthly S&P 500 average returns. Similarly, QE1 and QE3 were of near equal levels of Fed intervention and both larger than QE2 and both also reflected higher S&P 500 returns than those during QE2. In all cases after each QE program ended the S&P 500 returns remained positive. However the average returns became substantially lower monthly averages than during the active QE periods. Most notably, the only negative period for the S&P 500 returns was during the 2018 QT program when the Federal Reserve began their "asset normalization policy" to reduce liquidity in the market and lower the Fed balance sheet.
The chart below shows each of the different easing, tightening, and intervening periods along with the 10 year treasury price, Fed funds rate, and the S&P 500 index. In the period from December 2015 to 2018 the Fed was also increasing the Fed funds rate in nine additional tightening measures. Similar to today, the Fed fund rates will likely begin increasing again next week by 0.25 bps for the first time since 2019 and may contribute additional impact on the markets.
Bloomberg Finance
Forecasting the Market Impact
Now that we have just entered the period after the largest QE program since 2008 has ended, what should we expect?
Based on all the prior intervening periods, I would expect the S&P 500 monthly average returns to become less positive from April onward.
I would anticipate that a Fed asset normalization policy (QT) will be announced soon and would schedule the reduction of their balance sheet.
It appears that in periods after a QE program ended the returns of the S&P 500 though lower, remained higher after the larger QE programs than the smaller programs like QE2.
We have had only one quantitative tightening period to evaluate and it corresponded to negative S&P 500 returns and very high market volatility.
The guidance I will be looking for at the next FOMC meeting on March 16th, in addition to the Fed fund rate hikes, is how much time until quantitative tightening begins. Back in January we learned that the Fed discussed reducing their balance sheet "sooner than expected."
Minutes from the Fed's December meeting
released on Wednesday showed that officials had discussed shrinking the U.S. central bank's overall asset holdings as well as raising interest rates sooner than expected to fight inflation, with "many" judging the appropriate pace of the Fed's balance sheet reduction would be faster this time. ~ Reuters
Next, I will be looking at the schedule for asset unwind as was published in advance back in 2018 to allow the markets to try to absorb the reduced market liquidity. This schedule of Fed tightening in 2018 correlated strongly with the CBOE VIX volatility index as I wrote about frequently in those years.
VIX Trading Patterns To Watch Closely Through The Fed's Asset Unwind Into 2019 | Seeking Alpha MarketplaceVMBreakouts.com
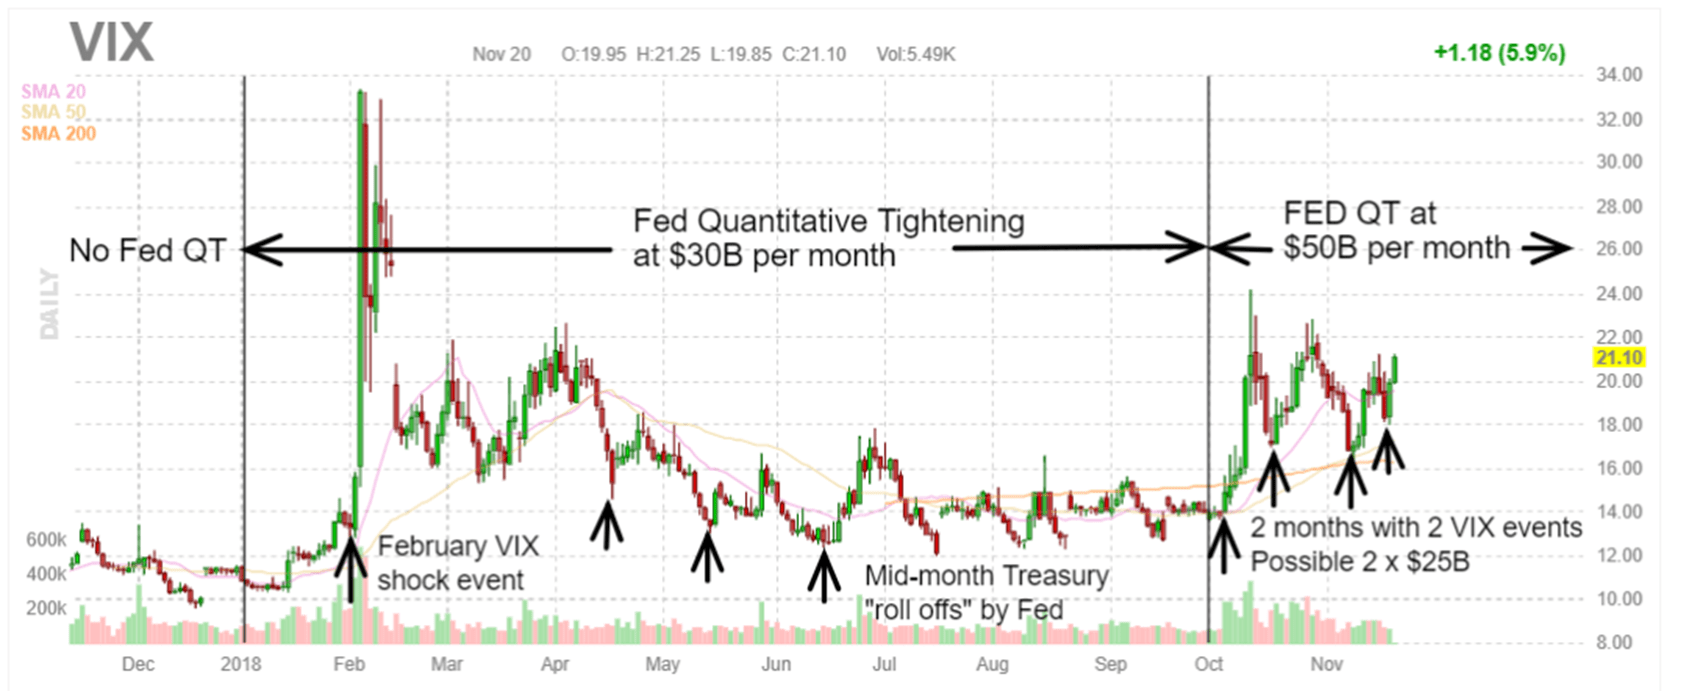
As the VIX volatility chart shows above, the reaction to the start of QT in 2018 resulted in a very strong shock event that was called Volmaggedon by many at the time. This very high volatility shock even led to the termination of VIX volatility funds and many VIX spikes over 20% that year:
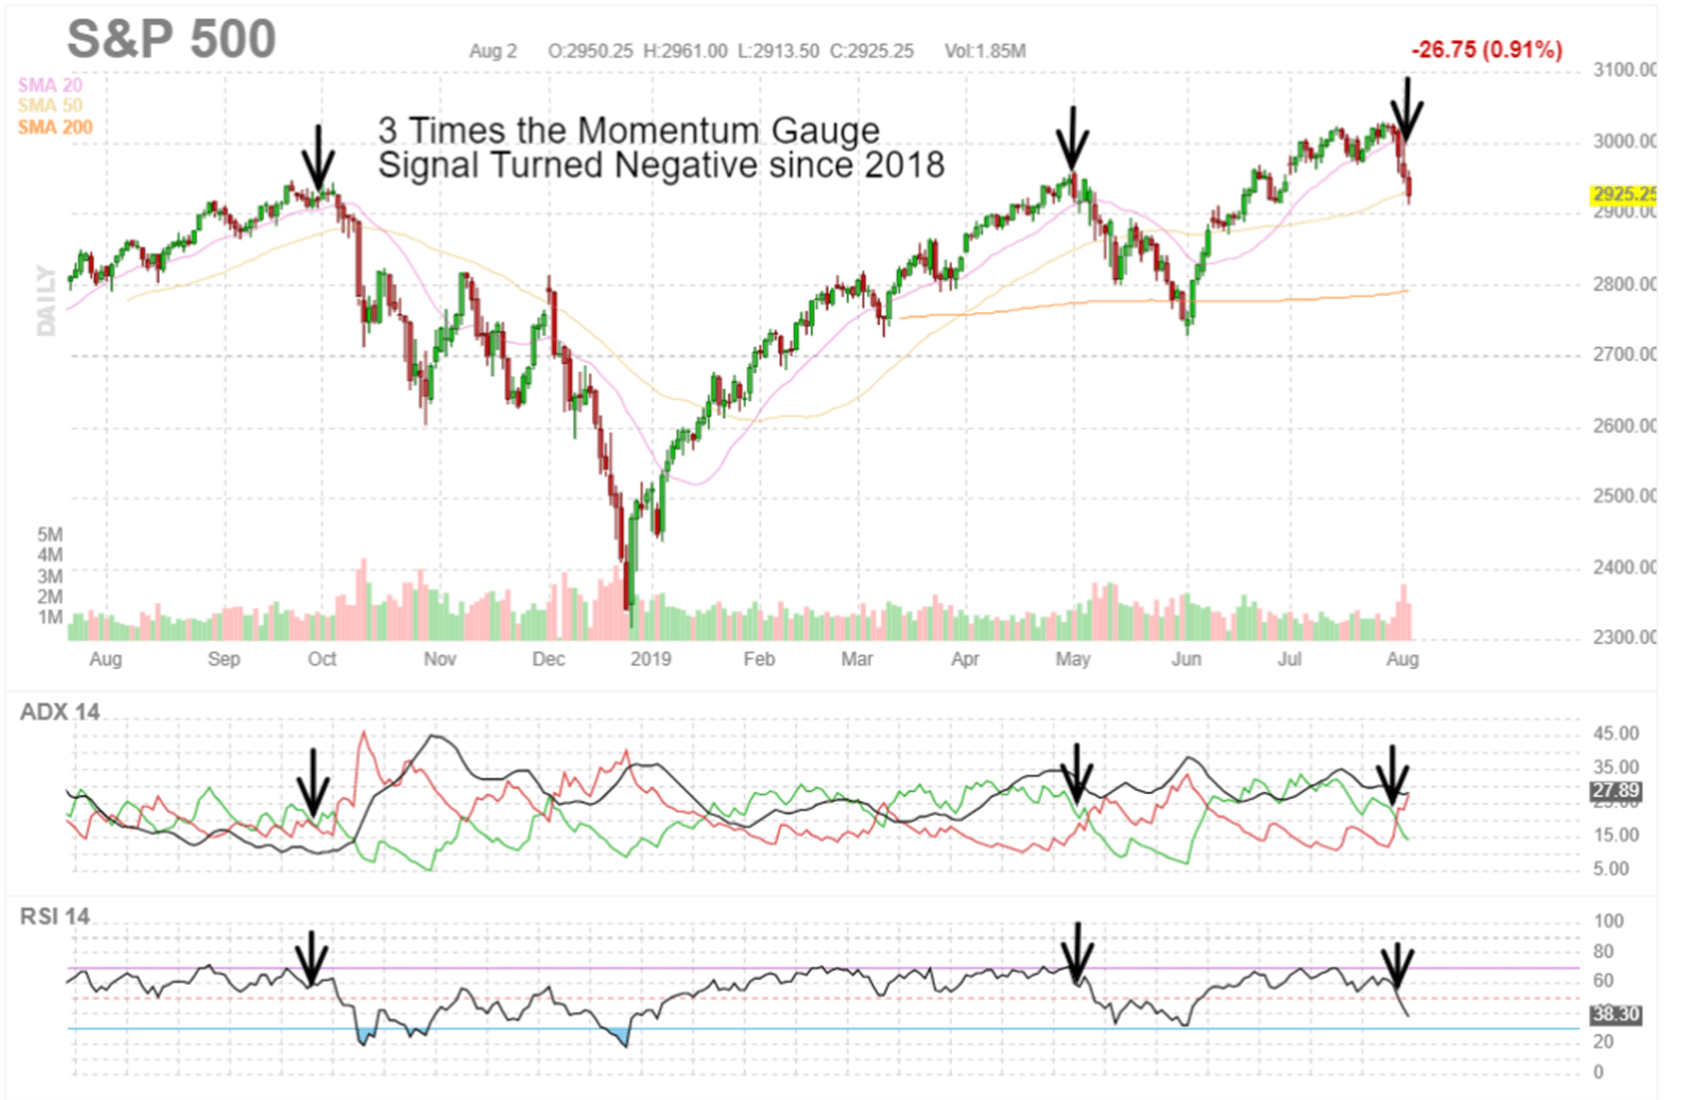
What Is The VIX Telling Us From 3 Prior Events?The initial tightening schedule by the Fed in the first part of 2018 of $30 billion in assets per month shows a very large VIX spike followed by dampening volatility through September. It was the subsequent hike in October to $50 billion in asset reduction per month that appeared to trigger more high volatility and the market correction that followed into December 2018. It was not until after the Fed halted tightening actions at the end of December that the market finally recovered. The Momentum Gauges® had just begun
weekly testing in 2018 and forecasted a downturn in Week 39 (the last week of September). From that point on the gauges have become a
major indicator for market forecasts and my investing activity.
FinViz.com
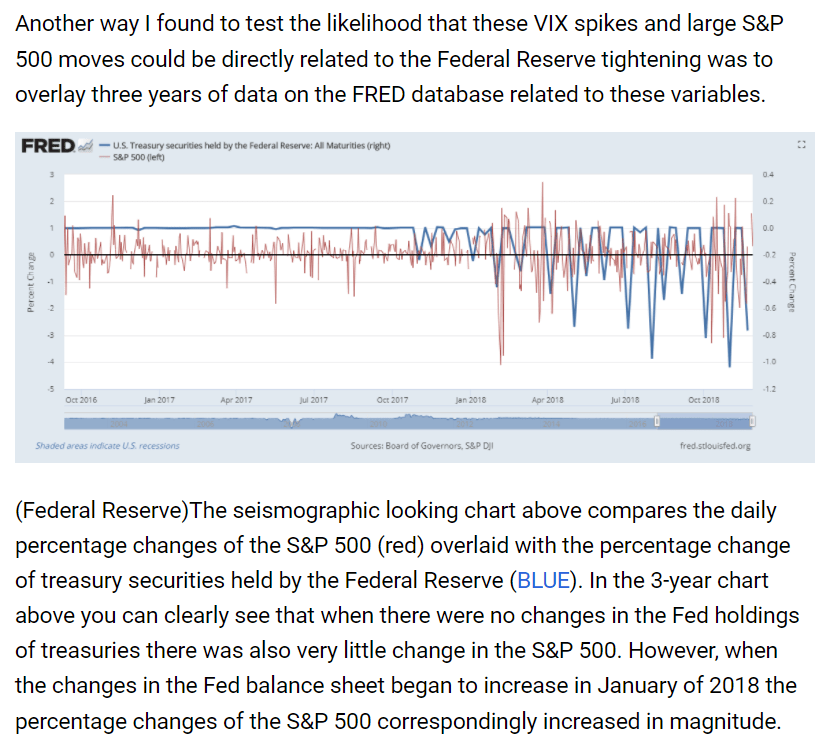
Related to this period of tightening in 2018, I conducted a study comparing the VIX volatility to the size of the reduction in treasury securities held by the Federal Reserve. The analysis detailed in articles linked above basically illustrates that the more the Fed reduced asset holdings, the higher the market volatility became:
VMBreakouts.com
Currently the Fed holds a large percentage of the treasury market now estimated at over 25% into 2022. This high balance shown below from record amounts of QE4 purchases increases the risk that future tightening events may be longer and more severe than we experienced in 2018.
refinitiv.com
Conclusion
There is no shortage of major economic factors that will continue to impact the market performance for 2022 and beyond. As I write this article, the Russian war in Ukraine continues and there is no certainty about when Russia will end their invasion or how much destruction will unfold in the coming weeks or months. Global sanctions ranging from oil, gas, grains, credit, shipping, and many basic materials have been put in place against Russia and the full economic impact is unknown. Inflation measures are at the highest levels in 40 years. The US GDP outlook is being revised lower and economic conditions are strained.
Many factors may affect the analysis shared here today. The purpose of this article is to provide some guidance about what the end of the largest QE program in U.S. history may mean to investors. It is my expectation that market returns will remain positive but lower on average in the coming months. I am most concerned about the timing and size of the coming asset normalization policy from the Federal Reserve. The information above is intended to provide readers with additional insight into the potential market reactions in the coming year.
Thanks for reading and all the best in your investing decisions!
JD Henning, PhD, MBA, CFE, CAMS